Attribute_Accuracy:
Attribute_Accuracy_Report: If the following table does not display properly, then please visit this internet
site <
https://www.nass.usda.gov/Research_and_Science/Cropland/metadata/meta.php> to
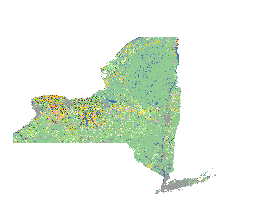
view the original metadata file. USDA, National Agricultural Statistics Service, 2020 New
York Cropland Data Layer STATEWIDE AGRICULTURAL ACCURACY REPORT Crop-specific covers only
*Correct Accuracy Error Kappa ------------------------- ------- -------- ------ -----
OVERALL ACCURACY** 340,658 73.0% 27.0% 0.659 Cover Attribute *Correct Producer's Omission
User's Commission Cond'l Type Code Pixels Accuracy Error Kappa Accuracy Error Kappa ----
---- ------ -------- ----- ----- -------- ----- ----- Corn 1 147492 87.8% 12.2% 0.850 87.5%
12.5% 0.846 Sorghum 4 368 30.7% 69.3% 0.307 69.2% 30.8% 0.691 Soybeans 5 40581 76.9% 23.1%
0.756 84.7% 15.3% 0.838 Sunflower 6 2 3.9% 96.1% 0.039 50.0% 50.0% 0.500 Sweet Corn 12 911
45.2% 54.8% 0.451 77.5% 22.5% 0.774 Barley 21 235 33.9% 66.1% 0.338 65.1% 34.9% 0.651 Durum
Wheat 22 0 n/a n/a n/a 0.0% 100.0% 0.000 Spring Wheat 23 35 21.7% 78.3% 0.217 55.6% 44.4%
0.555 Winter Wheat 24 15034 83.1% 16.9% 0.828 84.6% 15.4% 0.843 Dbl Crop WinWht/Soybeans 26
0 0.0% 100.0% 0.000 n/a n/a n/a Rye 27 301 18.3% 81.7% 0.183 57.6% 42.4% 0.575 Oats 28 2145
46.3% 53.7% 0.461 70.2% 29.8% 0.701 Millet 29 1 1.8% 98.2% 0.018 50.0% 50.0% 0.500 Speltz 30
38 25.3% 74.7% 0.253 65.5% 34.5% 0.655 Alfalfa 36 60803 74.2% 25.8% 0.717 76.5% 23.5% 0.742
Other Hay/Non Alfalfa 37 57240 65.7% 34.3% 0.623 69.9% 30.1% 0.668 Buckwheat 39 126 39.3%
60.7% 0.392 78.3% 21.7% 0.783 Sugarbeets 41 182 39.8% 60.2% 0.398 61.7% 38.3% 0.617 Dry
Beans 42 3318 56.8% 43.2% 0.566 75.3% 24.7% 0.752 Potatoes 43 1053 60.3% 39.7% 0.602 87.5%
12.5% 0.874 Other Crops 44 5 3.1% 96.9% 0.031 41.7% 58.3% 0.417 Misc Vegs & Fruits 47 0
0.0% 100.0% 0.000 0.0% 100.0% 0.000 Onions 49 747 78.4% 21.6% 0.784 79.2% 20.8% 0.792
Cucumbers 50 122 55.5% 44.5% 0.554 78.7% 21.3% 0.787 Peas 53 712 56.9% 43.1% 0.569 74.9%
25.1% 0.749 Tomatoes 54 0 0.0% 100.0% 0.000 0.0% 100.0% 0.000 Herbs 57 0 0.0% 100.0% 0.000
n/a n/a n/a Clover/Wildflowers 58 796 30.6% 69.4% 0.305 58.6% 41.4% 0.585 Sod/Grass Seed 59
414 74.9% 25.1% 0.749 80.4% 19.6% 0.804 Fallow/Idle Cropland 61 2306 33.5% 66.5% 0.332 52.8%
47.2% 0.525 Cherries 66 16 25.4% 74.6% 0.254 69.6% 30.4% 0.696 Peaches 67 13 18.6% 81.4%
0.186 36.1% 63.9% 0.361 Apples 68 2174 71.2% 28.8% 0.711 77.7% 22.3% 0.776 Grapes 69 1745
79.1% 20.9% 0.790 88.6% 11.4% 0.886 Christmas Trees 70 58 30.5% 69.5% 0.305 57.4% 42.6%
0.574 Other Tree Crops 71 0 0.0% 100.0% 0.000 n/a n/a n/a Pears 77 12 14.1% 85.9% 0.141
60.0% 40.0% 0.600 Triticale 205 377 25.4% 74.6% 0.253 73.1% 26.9% 0.730 Carrots 206 89 69.5%
30.5% 0.695 76.7% 23.3% 0.767 Broccoli 214 16 30.2% 69.8% 0.302 88.9% 11.1% 0.889 Peppers
216 0 n/a n/a n/a 0.0% 100.0% 0.000 Greens 219 1 1.8% 98.2% 0.018 16.7% 83.3% 0.167 Plums
220 0 0.0% 100.0% 0.000 0.0% 100.0% 0.000 Strawberries 221 0 0.0% 100.0% 0.000 0.0% 100.0%
0.000 Squash 222 208 39.9% 60.1% 0.399 84.9% 15.1% 0.849 Dbl Crop WinWht/Corn 225 0 0.0%
100.0% 0.000 n/a n/a n/a Dbl Crop Triticale/Corn 228 159 33.7% 66.3% 0.337 85.9% 14.1% 0.859
Pumpkins 229 33 20.1% 79.9% 0.201 40.2% 59.8% 0.402 Dbl Crop Barley/Corn 237 0 n/a n/a n/a
0.0% 100.0% 0.000 Blueberries 242 1 2.4% 97.6% 0.024 12.5% 87.5% 0.125 Cabbage 243 789 65.3%
34.7% 0.652 87.5% 12.5% 0.875 *Correct Pixels represents the total number of independent
validation pixels correctly identified in the error matrix. **The Overall Accuracy
represents only the FSA row crops and annual fruit and vegetables (codes 1-61, 66-80, 92 and
200-255). FSA-sampled grass and pasture. Non-agricultural and NLCD-sampled categories (codes
62-65, 81-91 and 93-199) are not included in the Overall Accuracy. The accuracy of the
non-agricultural land cover classes within the Cropland Data Layer is entirely dependent
upon the USGS, National Land Cover Database (NLCD 2016). Thus, the USDA, NASS recommends
that users consider the NLCD for studies involving non-agricultural land cover. For more
information on the accuracy of the NLCD please reference
<
https://www.mrlc.gov/>.
Quantitative_Attribute_Accuracy_Assessment:
Attribute_Accuracy_Value: Classification accuracy is generally 85% to 95% correct for the major
crop-specific land cover categories. See the 'Attribute Accuracy Report' section of this
metadata file for the detailed accuracy report.
Attribute_Accuracy_Explanation: The strength and emphasis of the CDL is crop-specific land cover categories. The
accuracy of the CDL non-agricultural land cover classes is entirely dependent upon the
USGS, National Land Cover Database (NLCD 2016). Thus, the USDA, NASS recommends that users
consider the NLCD for studies involving non-agricultural land cover. These definitions of
accuracy statistics were derived from the following book: Congalton, Russell G. and Kass
Green. Assessing the Accuracy of Remotely Sensed Data: Principles and Practices. Boca
Raton, Florida: CRC Press, Inc. 1999. The 'Producer's Accuracy' is calculated for each
cover type in the ground truth and indicates the probability that a ground truth pixel
will be correctly mapped (across all cover types) and measures 'errors of omission'. An
'Omission Error' occurs when a pixel is excluded from the category to which it belongs in
the validation dataset. The 'User's Accuracy' indicates the probability that a pixel from
the CDL classification actually matches the ground truth data and measures 'errors of
commission'. The 'Commission Error' represent when a pixel is included in an incorrect
category according to the validation data. It is important to take into consideration
errors of omission and commission. For example, if you classify every pixel in a scene to
'wheat', then you have 100% Producer's Accuracy for the wheat category and 0% Omission
Error. However, you would also have a very high error of commission as all other crop
types would be included in the incorrect category. The 'Kappa' is a measure of agreement
based on the difference between the actual agreement in the error matrix (i.e., the
agreement between the remotely sensed classification and the reference data as indicated
by the major diagonal) and the chance agreement which is indicated by the row and column
totals. The 'Conditional Kappa Coefficient' is the agreement for an individual category
within the entire error matrix.
Logical_Consistency_Report: The Cropland Data Layer (CDL) has been produced using training and independent validation
data from the Farm Service Agency (FSA) Common Land Unit (CLU) Program (agricultural data) and
United States Geological Survey (USGS) National Land Cover Database (NLCD). More information
about the FSA CLU Program can be found at <
https://www.fsa.usda.gov/>. More information
about the NLCD can be found at <
https://www.mrlc.gov/>. The CDL encompasses the entire
state unless noted otherwise in the 'Completeness Report' section of this metadata
file.
Lineage:
Source_Information:
Source_Citation:
Citation_Information:
Originator: Indian Space Research Organization (ISRO)
Publication_Date: 2020
Title: ResourceSat-2 LISS-3
Geospatial_Data_Presentation_Form: remote-sensing image
Publication_Information:
Publication_Place: Indian Space Research Organisation HQ, Department of Space, Government of
India Antariksh Bhavan, New BEL Road, Bangalore 560 231
Publisher: Indian Space Research Organization (ISRO)
Other_Citation_Details: The ISRO ResourceSat-2 LISS-3 satellite sensor operates in four spectral bands
at a spatial resolution of 24 meters. Additional information about the data can be
obtained at <
https://www.isro.gov.in/>. Refer to the 'Supplemental Information'
Section of this metadata file for specific scene date, path, row and quadrants used as
classification inputs. For the 2020 CDL Program, the imagery was resampled to 30
meters to match the Landsat spatial resolution. The resample used cubic convolution,
rigorous transformation.
Source_Scale_Denominator: 24 meter
Type_of_Source_Media: online download
Source_Time_Period_of_Content:
Time_Period_Information:
Range_of_Dates/Times:
Beginning_Date: 20191001
Ending_Date: 20201231
Source_Currentness_Reference: ground condition
Source_Citation_Abbreviation: LISS-3
Source_Contribution: Raw data used in land cover spectral signature analysis
Source_Information:
Source_Citation:
Citation_Information:
Originator: European Space Agency (ESA)
Publication_Date: 2020
Title: SENTINEL-2
Geospatial_Data_Presentation_Form: remote-sensing image
Publication_Information:
Publication_Place: European Commission, Brussels (Belgium)
Publisher: Copernicus - European Commission
Other_Citation_Details: The ESA SENTINEL-2 satellite sensor operates in twelve spectral bands at
spatial resolutions varying from 10 to 60 meters. Additional information about the
data can be obtained at <
http://www.esa.int/>. Refer to the 'Supplemental
Information' Section of this metadata file for specific scene date, path, row and
quadrants used as classification inputs. For the 2020 CDL Program, the imagery was
resampled to 30 meters to match the Landsat spatial resolution. The resample used
cubic convolution, rigorous transformation.
Source_Scale_Denominator: 10 meter
Type_of_Source_Media: online download
Source_Time_Period_of_Content:
Time_Period_Information:
Range_of_Dates/Times:
Beginning_Date: 20191001
Ending_Date: 20201231
Source_Currentness_Reference: ground condition
Source_Citation_Abbreviation: SENTINEL-2
Source_Contribution: Raw data used in land cover spectral signature analysis
Source_Information:
Source_Citation:
Citation_Information:
Originator: Elecnor Deimos Imaging
Publication_Date: 2020
Title: DEIMOS-1
Geospatial_Data_Presentation_Form: remote-sensing image
Publication_Information:
Publication_Place: Elecnor Deimos Imaging, Valladolid, Spain
Publisher: Astrium GEO Information Services
Other_Citation_Details: The DEIMOS-1 satellite sensor operates in three spectral bands at a spatial
resolution of 22 meters. Additional information about DEIMOS-1 data can be obtained at
<
https://www.deimos-imaging.com/>. Refer to the 'Supplemental Information'
Section of this metadata file for specific scene date, path, row and quadrants used as
classification inputs. The DEIMOS-1 imagery was resampled to 30 meters to match the
Landsat spatial resolution. The resample used cubic convolution, rigorous
transformation.
Source_Scale_Denominator: 22 meter
Type_of_Source_Media: online download
Source_Time_Period_of_Content:
Time_Period_Information:
Range_of_Dates/Times:
Beginning_Date: 20191001
Ending_Date: 20201231
Source_Currentness_Reference: ground condition
Source_Citation_Abbreviation: Deimos-1
Source_Contribution: Raw data used in land cover spectral signature analysis
Source_Information:
Source_Citation:
Citation_Information:
Originator: United States Geological Survey (USGS), Earth Resources Observation and Science
(EROS)
Publication_Date: 2020
Title: Landsat 8 Operational Land Imager and Thermal Infrared Sensor (OLI/TIRS)
Geospatial_Data_Presentation_Form: remote-sensing image
Publication_Information:
Publication_Place: Sioux Falls, South Dakota 57198-001
Publisher: USGS, EROS
Other_Citation_Details: The Landsat 8 OLI/TIRS data are free for download through the following
website <
https://glovis.usgs.gov/>. Additional information about Landsat data
can be obtained at <
https://www.usgs.gov/centers/eros>. Refer to the
'Supplemental Information' Section of this metadata file for specific scene date, path
and rows used as classification inputs.
Source_Scale_Denominator: 30 meter
Type_of_Source_Media: online download
Source_Time_Period_of_Content:
Time_Period_Information:
Range_of_Dates/Times:
Beginning_Date: 20191001
Ending_Date: 20201231
Source_Currentness_Reference: ground condition
Source_Citation_Abbreviation: Landsat 8
Source_Contribution: Raw data used in land cover spectral signature analysis
Source_Information:
Source_Citation:
Citation_Information:
Originator: United States Geological Survey (USGS) Earth Resources Observation and Science
(EROS) Data Center
Publication_Date: 2009
Title: The National Elevation Dataset (NED)
Geospatial_Data_Presentation_Form: remote-sensing image
Publication_Information:
Publication_Place: Sioux Falls, South Dakota 57198 USA
Publisher: USGS, EROS Data Center
Other_Citation_Details: The USGS NED Digital Elevation Model (DEM) is used as an ancillary data source
in the production of the Cropland Data Layer. More information on the USGS NED can be
found at
<
https://www.usgs.gov/core-science-systems/national-geospatial-program/national-map>.
Refer to the 'Supplemental Information' Section of this metadata file for the complete
list of ancillary data sources used as classification inputs.
Source_Scale_Denominator: 30 meter
Type_of_Source_Media: online
Source_Time_Period_of_Content:
Time_Period_Information:
Single_Date/Time:
Calendar_Date: unknown
Source_Currentness_Reference: ground condition
Source_Citation_Abbreviation: NED
Source_Contribution: spatial and attribute information used in land cover spectral signature
analysis
Source_Information:
Source_Citation:
Citation_Information:
Originator: United States Geological Survey (USGS) Earth Resources Observation and Science
(EROS) Data Center
Publication_Date: 2019
Title: National Land Cover Database 2016 (NLCD 2016)
Geospatial_Data_Presentation_Form: remote-sensing image
Publication_Information:
Publication_Place: Sioux Falls, South Dakota 57198 USA
Publisher: USGS, EROS Data Center
Other_Citation_Details: The NLCD 2016 was used as ground training and validation for non-agricultural
categories. Additionally, the USGS NLCD 2016 Imperviousness layer was used as
ancillary data sources in the Cropland Data Layer classification process. The NLCD2016
Tree Canopy data layer was not published in time for use in CDL production, so the
NLCD 2011 Tree Canopy data was used. More information on the NLCD 2016 and NLCD 2011
can be found at <
https://www.mrlc.gov/>. Refer to the 'Supplemental Information'
Section of this metadata file for the complete list of ancillary data sources used as
classification inputs.
Source_Scale_Denominator: 30 meter
Type_of_Source_Media: online
Source_Time_Period_of_Content:
Time_Period_Information:
Single_Date/Time:
Calendar_Date: unknown
Source_Currentness_Reference: ground condition
Source_Citation_Abbreviation: NLCD
Source_Contribution: Raw data used in land cover spectral signature analysis
Source_Information:
Source_Citation:
Citation_Information:
Originator: United States Department of Agriculture (USDA), Farm Service Agency
(FSA)
Publication_Date: 2020
Title: USDA, FSA Common Land Unit (CLU)
Geospatial_Data_Presentation_Form: vector digital data
Publication_Information:
Publication_Place: Salt Lake City, Utah 84119-2020 USA
Publisher: USDA, FSA Aerial Photography Field Office
Other_Citation_Details: Access to the USDA, Farm Service Agency (FSA) Common Land Unit (CLU) digital
data set is currently limited to FSA and Agency partnerships. During the current
growing season, producers enrolled in FSA programs report their growing intentions,
crops and acreage to USDA Field Service Centers. Their field boundaries are digitized
in a standardized GIS data layer and the associated attribute information is
maintained in a database known as 578 Administrative Data. This CLU/578 dataset
provides a comprehensive and robust agricultural training and validation data set for
the Cropland Data Layer. Additional information about the CLU Program can be found at
<
https://www.fsa.usda.gov/>.
Source_Scale_Denominator: 4800
Type_of_Source_Media: online
Source_Time_Period_of_Content:
Time_Period_Information:
Single_Date/Time:
Calendar_Date: 2020
Source_Currentness_Reference: ground condition, updated annually
Source_Citation_Abbreviation: FSA CLU
Source_Contribution: spatial and attribute information used in the spectral signature training and
validation of agricultural land cover
Process_Step:
Process_Description: OVERVIEW: The United States Department of Agriculture (USDA), National
Agricultural Statistics Service (NASS) Cropland Data Layer (CDL) Program is a unique
agricultural-specific land cover geospatial product that is produced annually in
participating states. The CDL Program builds upon NASS' traditional crop acreage
estimation program and integrates Farm Service Agency (FSA) grower-reported field data
with satellite imagery to create an unbiased statistical estimator of crop area at the
state and county level for internal use. It is important to note that the internal acreage
estimates, most closely aligned with planted acres, produced using the CDL are not simple
pixel counting. It is more of an 'Adjusted Census by Satellite.' SOFTWARE: ERDAS Imagine
is used in the pre- and post- processing of all raster-based data. ESRI ArcGIS is used to
prepare the vector-based training and validation data. Rulequest See5.0 is used to create
a decision tree based classifier. The NLCD Mapping Tool is used to apply the See5.0
decision-tree via ERDAS Imagine. DECISION TREE CLASSIFIER: This Cropland Data Layer used
the decision tree classifier approach. Using a decision tree classifier is a departure
from older versions of the CDL which were created using in-house software (Peditor) based
upon a maximum likelihood classifier approach. Decision trees offer several advantages
over the more traditional maximum likelihood classification method. The advantages include
being: 1) non-parametric by nature and thus not reliant on the assumption of the input
data being normally distributed, 2) efficient to construct and thus capable of handling
large and complex data sets, 3) able to incorporate missing and non-continuous data, and
4) able to sort out non-linear relationships. GROUND TRUTH: As with the maximum likelihood
method, decision tree analysis is a supervised classification technique. Thus, it relies
on having a sample of known ground truth areas in which to train the classifier. Older
versions of the CDL (prior to 2006) utilized ground truth data from the annual June
Agricultural Survey (JAS). Beginning in 2006, the CDL utilizes the very comprehensive
ground truth data provided from the FSA Common Land Unit (CLU) Program as a replacement
for the JAS data. The FSA CLU data have the advantage of natively being in a GIS and
containing magnitudes more of field level information. Disadvantages include that it is
not truly a probability sample of land cover and has bias toward subsidized program crops.
Additional information about the FSA data can be found at
<
https://www.fsa.usda.gov/>. The most current version of the NLCD is used as
non-agricultural training and validation data. INPUTS: The CDL is produced using satellite
imagery from the Landsat 8 OLI/TIRS sensor, the Disaster Monitoring Constellation (DMC)
DEIMOS-1, the ISRO ResourceSat-2 LISS-3, and the ESA SENTINEL-2 sensors collected during
the current growing season. The DEIMOS-1 and UK-DMC 2 imagery was resampled to 30 meters
using cubic convolution, rigorous transformation to match the traditional Landsat spatial
resolution. Some CDL states used additional satellite imagery and ancillary inputs to
supplement and improve the classification. These additional sources can include the United
States Geological Survey (USGS) National Elevation Dataset (NED) and the imperviousness
and canopy data layers from the USGS National Land Cover Database 2016 (NLCD 2016). Please
refer to the 'Supplemental_Information' Section of this metadata file for a complete list
of all imagery and ancillary data used to generate this state's CDL. ACCURACY: The
accuracy of the land cover classifications are evaluated using independent validations
data sets generated from the FSA CLU data (agricultural categories) and the NLCD
(non-agricultural categories). The Producer's Accuracy is generally 85% to 95% correct for
the major crop-specific land cover categories. See the 'Attribute Accuracy Report' section
of this metadata file for the full accuracy report. PUBLIC RELEASE: The USDA, NASS
Cropland Data Layer is considered public domain and free to redistribute. The official
website is <
https://www.nass.usda.gov/Research_and_Science/Cropland/SARS1a.php>. The
data is available free for download through CropScape
<
https://nassgeodata.gmu.edu/CropScape/> and the Geospatial Data Gateway
<
https://datagateway.nrcs.usda.gov/>. Please note that in no case are farmer
reported data revealed or derivable from the public use Cropland Data Layer.
Process_Date: 2020
Process_Contact:
Contact_Information:
Contact_Organization_Primary:
Contact_Organization: USDA, NASS, Spatial Analysis Research Section
Contact_Person: USDA, NASS, Spatial Analysis Research Section staff
Contact_Address:
Address_Type: mailing and physical address
Address: 1400 Independence Avenue, SW, Room 5029 South Building
City: Washington
State_or_Province: District of Columbia
Postal_Code: 20250-2001
Country: USA
Contact_Voice_Telephone: 800-727-9540
Contact_Facsimile_Telephone: 855-493-0447